Validation Techniques
- Team Charter
- Test and Learn Cards
- Hypothesis Creation
- Cost of Delay Prioritisation
- Effort/Value Matrix (2*2) Prioritisation
- A/B Testing
- Card Sorting
- Data Analysis
- NPS/ CSAT metric
- Lo-Fi Prototyping
- Service Design Blueprint Mapping
- Usability testing
- User Story Mapping
Team Charter
❓What is it
- A Team Charter is a collaborative document defining a team's purpose, objectives, norms, and working agreements, serving as a foundational guide for team interactions and expectations.
- It should be initially created as part of getting ready for the Validation phase, and reappraised from reflections out of retrospectives
👥 Who
- Team charter technique is a team exercise, typically facilitated by the Delivery Manager.
- Only the core team should be involved in the exercise
🛠 Running the technique
- If running this virtually, the team can use an existing Team Charter exercise template on Westminster’s Miro account
- A 1-2-4-All technique can be used to facilitate consensus on the key statements to form the team charter
- Ensure all team members agree with the statements drafted.
- Focus of the statements should be on behaviours, expectations of ways of working within the team, promoting respectful accountability with each other, and reflect the purpose of the teams’ goals
- The statements should be intuitive and memorable and recommend around 6 to 8 statements are used at the outset to encourage recall and adoption
- Review and refine the team charter at various points of the team’s journey from initial mobilisation through to maturity
📖Additional source
(Team charter activity template, Visual Workspace for Innovation (miro.com) - copy as image here?)
Test and Learn Cards
❓What is it
- A simple to use template that encapsulates the experiment to run against a defined hypothesis.
- The template offers a single view of what is being tested, how it will be measured, success criteria, results from the experiment and the actionable learnings deduced from the results
👥Who
- The test and learn card is typically drafted by a product manager or service designer. If the experiment is technically focused, an architect may draft the card
- Once drafted it is reviewed and baselined by the whole core team, and may be shared with key stakeholders
🛠 Running the technique
- Complete the left hand side of the card - write the target outcome you are hoping for in the format of a prediction. Start the statement with ‘We believe that by (action taken) … (resulting outcome seen) ‘. This is the Hypothesis statement
- Define the tests that will be run for the experiment to prove or disprove the hypothesis. Focus on identifying a causal relationship between action taken and resulting outcome to build a high level of confidence in the efficacy of the experiment.
- Make sure your hypothesis can be tested empirically, capturing the variables that need to be measured - this ensures that the team can meet the requirements as part of developing and running the experiment
- Define the success criteria, what the outcome should demonstrate to deem the hypothesis proven. The success criteria should be definitive, with suitable degrees of confidence(>95%) where large volumes of data may be involved.
- Capture a summary of the experiment result, and the key actionable learnings to take forward to prioritise future work in Validation
Hypothesis Creation
❓What is it
- Acknowledges that no matter how much research you do, your service enhancement is just a theoretical solution to a human need or want that you hope will result in success. The hypothesis is your guess at why a particular solution will succeed. Valuable hypothesis comes from well researched observations.
- Hypothesis creation is the approach to how to best formulate a hypothesis that offers a valuable outcome.
👥Who
- Hypothesis creation is best undertaken collaboratively between the product manager and user researcher with support from the service designer, if such capability is available within the team
🛠 Running the technique
- Imagine the change wanted that fully addresses the outstanding user need and write it down.
- Identify what is preventing this outcome from being achieved. If these causes were removed the outcome would already be a reality. These are the root of the hypothesis
- Ideate solutions that offer alternative options to achieving the outcome by removing these causes/blockers
- Create the full hypothesis statement in this recommended format.
WE BELIEVE THAT ( feature/service) WILL ( define what will change and how )
FOR (target user group) WHEN WE SEE (the success criteria)
Cost of Delay Prioritisation
(also known as CD3 or WSJF)
❓What is it
- A prioritisation approach to make value and urgency more visible. It quantifies an opportunity cost in economic terms when work is delayed, enabling more objective decision making and trade off decisions.
- There are two basic inputs required to work out the Cost of Delay:
- 1. Value – Calculate a value of the benefits per period, based on an estimation of the work’s economic value to the organisation over a given time period.
- 2. Urgency – An understanding of the work’s urgency: when do the benefits start to occur or deteriorate? Is there a calendar peak period that is critical to make ?
👥Who
- The technique is typically used by a product manager as part of prioritising their product backlog and gaining consensus across stakeholders with conflicting viewpoints of what work is most valuable
🛠 Running the technique
- Calculate a benefits figure for the change derived from value definition work already undertaken.
- Work out when the benefits would start being realised or when the expected benefits may deteriorate if at all
- Derive a Cost of Delay figure using a standard period of time e.g. month
- Repeat the steps for initiatives or backlog items competing for the same capacity
- This provides an objective comparison on which to achieve transparent consensus
📖Authoritative source
- Principles of Product Flow (Donald G. Reinertsen)
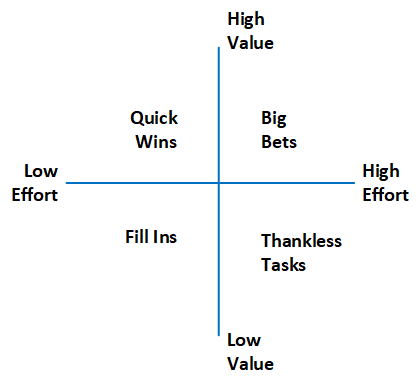
Effort/Value Matrix (2*2) Prioritisation
❓What is it
- It is used to help quickly prioritize a backlog of work associated to a service or product based on relative prioritisation. Each of the items are assessed against two criteria: the value that is realised from delivering it, and the effort required to complete it.
- It is the recommended prioritisation approach for backlogs with a large number of items(>20) for teams with little previous experience or competency in this activity.
- The key benefits for this technique are: Quick to understand and use for team members new to the service/initiative/product; strong visualisation to engender further discussion; highly productive in processing large backlog volumes in a short space of time; inherently enables high granularity of ordering; clear recommended next actions for each quadrant
👥Who
- Lead by the product manager, this technique only works well with a cross functional team and service SMEs working in a collaborative environment, with presence of at least one architect or developer
🛠 Running the technique
- Find a backlog item that to use as the anchor: find a previously delivered item on the backlog with a clear purpose, and effort taken and value expected would roughly enable it to sit in the middle of the matrix.
- Agree as a team to how value is defined to ensure consistency throughout the exercise
- Assess one item at a time, one person facilitates selecting and sharing details. Discuss and agree where to place it relative to the anchor item.
- Start with two or three more straightforward items (helps build confidence and understanding)
- Once completed, next recommend actions are Big bets ( top right) should be further broken down to identify and derisk the large effort estimate. Quick wins (top left) should be grouped against top level objectives and requalified.
- Agree sequencing of the items in the top left and top right segments.
A/B Testing
❓What is it
- Also known as Split testing is a method of comparing two versions of a digital asset, such as webpage or app against each other to determine which one performs better in terms of a given metric or objective. The idea is to show two variants (A and B) to similar users at the same time and then compare which variant better meets the desired action.
- Only one change can be tested at a time to ensure efficacy of the results
👥Who
- Collaboration between core team to design and run the test
🛠 Running the technique
- Hypothesis Creation: Before starting the test, you need a hypothesis. For example, you might hypothesize that changing of the position of ‘Register Account’ button from the bottom to the middle right will increase click-through rate of non registered users.
- Variants Creation: Based on your hypothesis, you would create two versions of the digital asset: Variant A: The current version (often called the "control"), Variant B: The new version with the change you want to test.
- Traffic Splitting: Visitors to the digital asset are randomly shown either variant A or variant B. Often, the traffic is split 50/50, but other ratios can be used depending on the circumstances.
- Data Collection: As visitors interact with each version, data is collected on how many take the desired action
- Result Analysis: After a sufficient amount of data is collected, the results are analysed. Statistical analysis helps determine if the differences in performance between the two variants are significant (i.e., not just due to random chance).
- Implementation: If Variant B (the change) proves to significantly outperform Variant A (the control), then you might decide to fully implement the change. If not, you can revert to the original or try a different test.
📖Additional source
- https://www.optimizely.com/optimization-glossary/ab-testing
Card Sorting
❓What is it
- Card sorting is a user-centred design technique used to explore how users group and categorize information, helping designers create or refine the information architecture of websites, apps, and other systems.
- This technique is particularly valuable in designing intuitive navigation structures and layouts based on users' mental models rather than the organization's internal perspectives or terminologies.
- Its specific purpose is to (1) understand how users perceive relationships and hierarchies between different pieces of content, (2) inform the structure and organization of a digital asset such as website, (3) improve or validate the design of navigation paths and menu structures.
👥Who
- Service Designer or User Researcher
🛠 Running the technique
- Preparation: Decide on the pieces of content or functionalities you want insights on. Write each piece on a separate card (physical cards, sticky notes, or digital equivalents).
- Sorting: Ask participants to sort the cards into groups that make sense to them. There are two main types of card sorting:
- Open Card Sorting: Participants create their own groups and name them. This method is useful for gaining insights into users' mental models and terminologies.
- Closed Card Sorting: Participants sort the cards into predefined categories. This is helpful when refining an existing structure.
- Analysis: After the sorting is complete, analyse the data to identify patterns, commonalities, and outliers in how participants grouped and labelled the cards. Further iterations of the exercise maybe valuable where the initial changes were substantive
📖Additional source
Data Analysis
❓What is it
- Data analytics is the process of analysing raw data in order to draw out meaningful, actionable insights, which are then used to inform and drive prioritisation and decision making.
- It is a key pillar of lean experimentation, in inspecting the outcome from running an experiment supporting a hypothesis. If the data sources points
- A key aspect of data analytics is attaining a suitable confidence interval(statistical significance) in the interpretation and validation of the summary analysis, to then drive subsequent decisions. This technique is focused on descriptive and diagnostic analytics
👥Who
- One of Data Analyst or Product Manager or Service Designer, or combinations thereof.
🛠 Running the technique
- Undertake a data audit against the key metrics that matter for the prioritised hypotheses and associated experiments so you can understand what data is captured, where it is captured and how to access it.
- Typical data sources include: Google Analytics for web based services, back office tools, customer support tools, 3rd party application providers, specialist experience management or product analytics tools (e.g. Qualtrics, Qualaroo, Heap, Amplitude)
- Inspect the data to ascertain the efficacy of both the raw data and how it is surfaced for interrogation by your team members.
- Where there is significant knowledge gaps for a current service, create a visual mapping on top of a service blueprint or customer journey map to identify the data source, metrics supported, level of confidence in its efficacy
- Work with the data analyst or architect or developer to identify the smallest effort to bridge the gap to attaining the metrics needs to complete the validation phase
NPS/ CSAT metric
❓What is it
- NPS and CSAT are the two primary industry wide measures to gauge end users overall satisfaction with a service and associated organisation.
- NPS stands for Net Promoter Score, and It measures user perception based on one simple question: ‘How likely is it that you would recommend the service / product to a friend or colleague?’ Responses fall into 3 categories, Promoters, Passives and Detractors.
- CSAT stands for Customer Satisfaction Score. While NPS provides a broader view of user perception of the organisation, CSAT provides a measure of short term user satisfaction with a specific interaction, product or service. CSAT is typically focused on more transactional and specific touchpoints.
- A combination of these two metrics provides invaluable near term and trending insight on user satisfaction.
👥Who
- Product Manager or Data Analyst
🛠 Running the technique
- For both NPS and CSAT, design the survey, question for the survey and distribution channel to reach the relevant section of users.
- For NPS the question is standard, "On a scale of 0 to 10, how likely are you to recommend [Organisation/Product/Service] to a friend or colleague?" One additional open question can be added to the survey to allow users to volunteer any additional comments..
- For CSAT, the response to a typical question, “How satisfied were you with your experience//service today” and a Likert scale is used to capture the response. CSAT surveys typically focus on sourcing feedback on improvements, new features or services to quickly validate that the proposed solution fully meets the needs of the users..
- Apply the standard formulae for both NPS and CSAT to derive the relevant scores.
📖Authoritative source
Lo-Fi Prototyping
❓What is it
- Lo-fi or low-fidelity prototyping, is a technique used in the early stages of the design process to create a simplified representation of a product or system. The primary goal of lo-fi prototyping is to visualize and test ideas quickly, allowing designers and stakeholders to iterate and refine concepts without investing significant time and effort.
- Its primary advantage during the validation phase is speed and velocity and reach. Speed to get something in the hands of end users to quickly and cheaply validate key assumptions, which allows a number of prototypes to be tested in a small time window.
- Because they are quick and cheap to produce, there's less emotional or financial attachment, making it easier for the fail fast principle to be collaboratively adopted with the team and stakeholders.
👥Who
- UX or Service Designer
🛠 Running the technique
- Good lo-fi prototypes should have the following characteristics: Speed to enable fast iterations from user feedback; Simplicity to reduce effort in creating and revising future versions, with ruthless focus on the core feature being tested; collaborative to encourage involvement and feedback from users and stakeholders
- Common methods include:
- Paper Prototypes: sketched wireframes, paper cut outs, printed screens, or hand drawn images
- Storyboarding: Sequence of drawings or pictures to outline user journeys or interactions.
- Clickable Prototypes using standard UX design software such as Sketch or Figma
Service Design Blueprint Mapping
(Future State)
❓What is it
- Service Design Blueprints come in two forms - current and future state mapping.
- A Future State Service Blueprint, much like a Current State Service Blueprint, is a visualisation tool used in service design. However, while the Current State Service Blueprint is used to map out the service as it exists presently, a Future State Service Blueprint represents how an organisation would like the service to be in the future. The purpose of a Future State Service Blueprint includes:
- Service Innovation and Improvement, Strategic Planning, Stakeholder Alignment, Implementation Roadmap, Change Management, Testing and Refinement
👥Who
- Service Designer or T-shaped UX designer
🛠 Running the technique
- A current live service should have an existing current state blueprint. If this is missing, then the team should make a decision on the value of completing this exercise.
- A Service Blueprint can range from a few days to several weeks or even months for very complex services or detailed blueprints. It's important to remember that the blueprinting process isn't just about creating the final artifact - the process of gathering information, involving stakeholders, and thinking through the service can be equally valuable. Work with the product manager to agree the level of detail that delivers the most valuable outcome in a timely manner.
- The Future State Service Blueprint should be detailed enough to capture all the proposed changes and how they will impact the service delivery and prioritised solution approach
📖Authoritative source
- (CSD miro board for detailed understanding of the process)
Usability testing
❓What is it
- Usability testing is a research method used to evaluate how usable, desirable and intuitive a service or feature is, by testing it with representative users. In this technique, participants are asked to complete specific tasks while observers watch, listen, and take notes. The goal is to identify any usability issues, collect qualitative and quantitative data, and determine the participant's satisfaction with the service.
- Typically, usability tests are conducted in a controlled setting, though remote usability tests are also common. Participants are asked to perform a series of tasks, often while thinking aloud, to provide insight into their cognitive processes. This helps the team understand not just what issues exist but also why they exist, providing a rich context to interpret results and make improvements.
👥Who
- Service Designer or UX Designer
🛠 Running the technique
- The core elements in most usability tests are the facilitator, the tasks, and the participant.
- The facilitator plans the usability test: define the test’s goals, participant selection approach, types of data to collect
- Recruit the right type of participants, typically 5 for qualitative studies. The participants should be a realistic user of the product or service being studied. That might mean that the user is already using the product or service in real life.
- Prepare and set up the test environment to provide the best outcomes for the target goal, e.g. testing in person or remote
- The facilitator administers tasks to the participants. As the participant performs these tasks, the facilitator observes the participant’s behavior and listens for feedback. The facilitator may also ask followup questions to elicit detail from the participant. Participants are often asked to think out loud during usability testing (called the “think-aloud method”).
- Analyse the results to surface critical insights against the target goals defined at the outset.
📖Authoritative source
User Story Mapping
❓What is it
- User story mapping is a visual representation of the user journey across a product or service. It helps teams understand the functionality and prioritise development tasks, ensuring that the user's perspective and needs remain at the forefront.
👥Who
- User story mapping only delivers any benefit when done as a team activity. The whole core team should take part in this activity to ensure diversity and aligned understanding on any MVP candidates.
🛠 Running the technique
- Find a large wall or digital collaboration tool like Miro. Begin by outlining the backbone of your user's journey. This is a series of high-level activities or key steps the user goes through when interacting with the service.
- These are positioned sequentially from left to right, reflecting the order in which they typically occur.
- Below each high-level activity, you'll break it down into more granular tasks or sub-activities.
- Now, for each of these tasks or sub-activities, you'll develop a user story or backlog item.
- The vertical positioning of user stories under each activity can indicate priority, with higher priority items at the top.
- This helps teams understand what should be developed first to deliver the most valuable features to the user early on.
- By viewing the map, teams can group certain user stories together into logical releases or iterations. This is especially useful when determining the features for a Minimum Viable Product (MVP) versus those for subsequent releases.