Techniques Guide
- Ideation Techniques
- Value Proposition Canvas
- OKR Mapping
- Ideation Workshop
- Amazon PR release
- 6 Thinking Hats
- Idea capture form
- Discovery Techniques
- 5 Whys
- Value Proposition Canvas
- Empathy Mapping
- User Journey Mapping
- OKR Mapping
- Problem Definition
- Opportunity Solution Tree
- User interviews
- Observational study
- Surveys
- Assumption impact quadrant matrix
- Validation Techniques
- Team Charter
- Test and Learn Cards
- Hypothesis Creation
- Cost of Delay Prioritisation
- Effort/Value Matrix (2*2) Prioritisation
- A/B Testing
- Card Sorting
- Data Analysis
- NPS/ CSAT metric
- Lo-Fi Prototyping
- Service Design Blueprint Mapping
- Usability testing
- User Story Mapping
- Delivery Techniques
- User Story Mapping
- 3Cs (Backlog Refinement)
- User Story Writing
- Cost of Delay Prioritisation
- Effort/Value Matrix (2*2) Prioritisation
- BDD - Behaviour Driven Development
- Vertical Story Slicing
- User Story Splitting
- Estimation - Planning Poker
- Sprint Planning
- Sprint Retrospectives
- Sprint Review
- Infrastructure as Code (IAC)
- Run Techniques
Ideation Techniques
Value Proposition Canvas
❓What is it
- A value proposition framework is a structured approach to defining and communicating the unique value that a product or service offers to its target users.
- The framework is designed to offer a complete, holistic view of each of the key components that enable a valuable outcome to be achieved.
👥Who
- The framework is long lived, employed during both the Discovery and Validation phase across a multi disciplinary team to capture and refine each of the framework components
🛠 Running the technique
- The product lead populates the initial version of the value proposition canvas during Discovery.
- Start with the Vision Statement, Needs and Pain Points(one per primary target user group), and key Assumptions
- As Discovery progresses, the next sections to address are the Opportunity, Value Proposition Statement and Strategic Objective Fit
- As Discovery ends there should be sufficient understanding to complete the Approach, Metrics and Costs section
- Each of these components should be further refined during the Validation phase and provide the key input into a formal business case
📖Authoritative source
- Value Proposition Framework template
OKR Mapping
❓What is it
- Identifies and aligns objectives or goals defined at a service/product level with those objectives and key results defined at a portfolio or directorate level.
- This ensures transparency across the team that the value outcomes are fully supportive in contributing to the strategic objectives of the directorate owning the service or product.
👥Who
- OKR mapping is typically lead by the product manager or service owner. Validation of the mapping is attained through collaborative discussions with the owners of the directorate level OKRs
🛠 Running the technique
- Obtain the current version of the directorate level OKRs, if they exist. If not, then substitute with Westminster level objectives.
- Run an OKR session with the team and business sponsor/service owner to draft 2 to 3 objectives, and 3 to 5 key results per objective.
- Key results should have a timeline of no more than one year
- Identify which service level objectives and key results directly contribute to attaining a directorate level key result or objective
- Capture this mapping in the value proposition framework
- Refine the initial mapping exercise through collaborative reviews with the owners of the directorate level OKRs
Authoritative source
- (see Book on creating OKRs)
Ideation Workshop
❓What is it
- This collaborative technique involves running a physical or virtual session to actively explore the broad space associated to the opportunity, to generate new ideas or expand on existing idea candidates that support the realisation of an opportunity that is deemed valuable to the organisation.
👥Who
- Product Manager brings together a group of people, preferably between 7 to 12 participants who have an interest in this topic, but come from diverse backgrounds, e.g. technology, strategy, customer service, product, end user service owners.
🛠 Running the technique
- A prerequisite of running a successful workshop is clear framing of the opportunity. This may be in the form of one or more of the following:
- Draft vision statement, a PR release, secondary market or technology research extracts, industry case studies, high level opportunity statement (How might we…)
- Plan the workshop - agenda, participants, pre reading material, outcomes, format
- On the day, prepare the virtual or physical space to encourage participants to immerse themselves in the opportunity area
- It is always recommended to start the workshop with an ice breaker, followed by a fun creative exercise. An example of this is playing an alternative use game with a household item
- Use some of the prepared materials such as vision statement or PR release to trigger the main ideas creation activity, encouraging non judgemental divergent thinking to generate a broad range of ideas. If the flow of ideas is low, try a What If technique to re-energise the room
- Use the next activity to work as a team to theme some of these ideas. Capture all the ideas, with top level themes into an ideas backlog for future reflection and refinement.
Amazon PR release
❓What is it
- A future visioning technique to articulate the benefits of the idea at the point of it being launched. It employs a PR release format, similar in content and tone as as would be used for launching the idea as a real world service/product.
👥Who
- This can be completed as an individual activity by the owner of the idea or as a collaborative exercise with colleagues knowledgeable in the idea space.
🛠 Running the technique
6 Thinking Hats
❓What is it
- Design thinking and group discussion are highly complex processes in which thoughts are shared, ideas bubble up, and others are buried. De Bono’s Six Thinking Hats technique provides a systematic solution to sharing and improving ideas by eliminating idea-destructive elements during brainstorming meetings. The method is based on the metaphor of wearing different "hats," with each hat representing a different mode of thinking or viewpoint.

👥Who
-
It is recommended to have between 3 and 6 participants and a facilitator, all with strong knowledge in the relevant idea space .
🛠 Running the technique
- The group swaps hats in an agreed order. All participants wear the same hat at each stage of the exercise. For idea creation, the following sequence is recommended.

- The white hat set sets the scene representing the facts and information about the opportunity space.
- The green hat sparks brainstorming of ideas in the opportunity space.
- The blue hat facilitates reflection on the ideas generated, and begins to group them into high level themes
- The red hat provides an opportunity for the group to articulate their intuitive feelings, positive or negative, about the ideas generated and their potential
- The black hat enable the group to surface risks and challenges on the ideas generated and the opportunity space in general.
📖Additional source
Idea capture form
❓What is it
- A template that provokes a product mindset and critical thinking to develop, articulate and self-validate the idea has genuine value and potential to meet real user needs and support the objectives of the directorate and/or Westminster
👥Who
- Owner of the idea. If they struggle completing some of the sections support from a CSM or strategy or subject matter expert related to the opportunity space
🛠Running the technique
- Complete the form in this order:
- Idea name: Write a simple phrase that captures the essence of the idea.
- Idea description: Complete the following value statement to summarise to illustrate why this is a valuable idea. If this idea helps more than one end user, please repeat this for each user group. “ The idea..... helps .......end user who want to.... what they want to achieve..... by ........describe how it helps the user achieve this ”
- Which strategic objective does this support: Prefilled options reflecting the current organisational/directorate objectives
- Understanding the problem: What evidence is there that there is a real problem for these end users today? Please describe any evidence you are aware of that illustrates there is a real need for this idea. Where possible provide any data / numbers that supports your view.
- Understanding the size of the opportunity: Can you quantify how many or what percentage of the council users would directly benefit from this idea? If possible, estimate the number. Please demonstrate your assumptions in reaching that estimate
- Key assumptions/unknowns: What are your biggest assumptions that underpin the idea delivering this value? Are there any key unknowns that need to be addressed to validate the idea may have value.
📖Additional source
(Idea capture form template on Ways of working Miro)
Discovery Techniques
5 Whys
❓What is it
- This analytical technique is intended to get to the root cause of a problem by asking ‘why’ or ‘what caused this several times.
- Each question seeks a deeper understanding until the asker discovers the root issue.
👥Who
- Bring together people who have knowledge about the area in question.
🛠 Running the technique
- Describe the problem as well as you can – use a whiteboard to write up a description that everyone agrees with.
- Ask why the problem occurs. Draw a line from problem to the suggested cause A.
- Ask why cause A occurs. Draw a line from cause A to new cause B.
- Continue until it feels impossible to discover a further root. In practice you may ask ‘why’ fewer than 5 times. It is also possible that a problem might have more than one root cause.
- Ensure everyone agrees that resolving the root cause would stop the problem at the top from occurring.
Value Proposition Canvas
❓What is it
- A value proposition framework is a structured approach to defining and communicating the unique value that a product or service offers to its target users.
- The framework is designed to offer a complete, holistic view of each of the key components that enable a valuable outcome to be achieved.
👥Who
- The framework is long lived, employed during both the Discovery and Validation phase across a multi disciplinary team to capture and refine each of the framework components
🛠 Running the technique
- The product lead populates the initial version of the value proposition canvas during Discovery.
- Start with the Vision Statement, Needs and Pain Points(one per primary target user group), and key Assumptions
- As Discovery progresses, the next sections to address are the Opportunity, Value Proposition Statement and Strategic Objective Fit
- As Discovery ends there should be sufficient understanding to complete the Approach, Metrics and Costs section
- Each of these components should be further refined during the Validation phase and provide the key input into a formal business case
📖Authoritative source
- (URL housing the Value Proposition Framework template )
Empathy Mapping
❓What is it
- A collaborative technique used by user research to build a broader understanding of user needs, desires, and challenges.
- Empathy maps are particularly useful during the discovery phase of product or service design and are a key component of human-centred design.
👥Who
-
Empathy mapping is primarily employed by user research and service design capability, with support from other key stakeholders and team members
🛠 Running the technique
-
Agree the user group you are mapping and the goal for the exercise - cross reference the value proposition framework
- Gather insights from direct user interviews, observations, surveys, or any other form of user feedback
- Collaborate with a broad spectrum of colleagues who have knowledge of the service and user group
- Fill in the map template, starting with the What You See section. Initially use physical or virtual sticky notes to capture insights for each quadrant. As insights are added, identify emerging patterns and summarise accordingly
- Reflect and analyse. Discuss key findings with the team and cross reference against the needs and pain points component of the value proposition framework
📖Authoritative source
User Journey Mapping
❓What is it
- A customer journey map is a visual representation of the activity a user undertakes to achieve a goal with a product or service. It captures the various touchpoints, experiences, emotions, and paths and helps identify the pain points and associated opportunities to enhance the current service. The key components should include: User profile, main activities, channels and touchpoints with the organisation, emotional sentiment per activity (pain, delight), pain points.
👥Who
- The service designer or user researcher typically leads this activity by bringing together all people in the organisation that support any of the interaction points mapped on the journey
🛠 Running the technique
- Define and understand the purpose of the map, e.g. is it to improve a specific touchpoint, to reimagine a service, or to enhance the overall experience?
- Gather data through methods like surveys, interviews, analytics, and user feedback to gain insights into the customer's experiences and pain points. It is recommended to run at least one workshop with key team members and service actors to accelerate initial creation
- Outline the stages, touchpoints, emotions, etc., based on the data and feedback provided
- Validate and refine the map based on initial feedback and alignment with the vision and value proposition statements
- Work collaboratively with the product manager or delivery manager reassess the problem statements and value opportunity
OKR Mapping
❓What is it
- Identifies and aligns objectives or goals defined at a service/product level with those objectives and key results defined at a portfolio or directorate level.
- This ensures transparency across the team that the value outcomes are fully supportive in contributing to the strategic objectives of the directorate owning the service or product.
👥Who
- OKR mapping is typically lead by the product manager or service owner. Validation of the mapping is attained through collaborative discussions with the owners of the directorate level OKRs
🛠 Running the technique
- Obtain the current version of the directorate level OKRs, if they exist. If not, then substitute with Westminster level objectives.
- Run an OKR session with the team and business sponsor/service owner to draft 2 to 3 objectives, and 3 to 5 key results per objective.
- Key results should have a timeline of no more than one year
- Identify which service level objectives and key results directly contribute to attaining a directorate level key result or objective
- Capture this mapping in the value proposition framework
- Refine the initial mapping exercise through collaborative reviews with the owners of the directorate level OKRs
Problem Definition
❓What is it
- Defines a perceived unmet user need in a clear, concise description through the use of a problem statement template. The problem statement applies a number of lenses to the problem area, assisting the author to surface aspects that require further analysis and research. This technique assists in not diagnosing the more easily observed symptoms as the defined problem.
👥Who
-
Problem definition is a joint activity lead by the product manager, user researcher and service designer
Initial outputs are then refine through collaborative sessions with the service owner and direct user research - Identify the problem space and draft a simple sentence that describes what the problem is and who is it a problem for
🛠 Running the technique
- Find supporting evidence that this is a material problem and not anecdotal in nature (ie. it happens to 100s of users and not just 4 or 5)
- Understand the symptoms of the problem, allowing you to get closer to identifying the root cause
- Formally capture the problem statement using a template. This should help identify if there are multiple problem statements that should be broken out into their own problem statements and addressed separately
- If there are multiple problem statements, assess which problem statements are likely to have the biggest impact, ie which problems hold the most value in being solved.
- Refine the problem statements throughout discovery and validation to be accurately reflected in the value proposition framework
📖Authoritative source
(Ways of working problem statement template Miro)
Opportunity Solution Tree
❓What is it
- A visual aid that can help you find the best place to focus your team’s energies on which problems to solve, whilst ensuring you consider enough opportunities.
👥Who
- Bring together the team and other key stakeholders with insight on the problem/opportunity area for an initial session - recommend around 5-8 people
- Then use a much smaller group to review and refine in a follow up session - no more than three people
🛠 Running the technique
- Have the Product Lead/Business Owner pick a desired outcome.
- Generate opportunities (or problem statements) for achieving the desired outcome. Discuss as a team. (tip: if your team jumps straight to solutions, ask them what specific problem their solution solves, and capture that).
- Brainstorm solutions to specific opportunities. Discuss as a team.
- Have the team vote on the solutions with the most potential for success
- Prioritise hypothesis to test for the top solution ideas.
📖Authoritative source
User interviews
❓What is it
- This is a cornerstone of qualitative research, and is recommended that some user research is always conducted during discovery.
- This technique supports and enhances other available qualitative and quantitative research, by providing depth and nuance that other research methods may miss. Its conversational nature can capture their thoughts, feelings and motivations, enabling deeper sentiment analysis around the problem space.
- For qualitative research, the right sample size is between 5 and 10 per target profile to capture all key emergent themes - the saturation point
👥Who
- User researcher. It can benefit having 2 people per interview, one acting as a note taker.
🛠 Running the technique
- Prepare - Set a goal and success metrics for your interviews, write a customer interview guide with open-ended interview questions, and recruit the right candidates that fit each target profile. Be mindful of leading questions. Ensure sufficient time to allow for unexpected topics that may surface. Prepare more questions than you think you’ll need. Anticipate different responses and create follow-up based questions based on your research goals. Don’t forget the questions are a guide, not a script.
- Interview - Employ an empathetic approach, to help build a rapport with the interviewee, with a strong focus on active listening. Be cognisant of biases throughout the interview- examples include confirmation bias, anchoring bias, Hawthorne effect. It can be helpful to have a colleague present to focus on detail note taking. An alternative is to record the interview. Be mindful of user research ethics, being open and transparent on how the interviewee’s information and persian details will be stored and used.
- Insights - Use a visual centric tool like Miro or Mindmap to capture and summarise key themes, sentiments and observations associated to the research goal and problem space across multiple interviews. Identify if saturation has been reached for that user profile
📖Authoritative source
Observational study
❓What is it
- Watching and analysing users in their natural environment to understand their behaviours, needs, pain points, and the context in which they interact with products or services.
- Observing how users may interact with a service or product is a great first hand way to understand its usability in real world settings. Conducting observations can be straightforward for most services and can be a relatively fast way to identify problems, needs and opportunities that might not be apparent through other research methods or self-reported feedback.
👥Who
- User researcher.
🛠 Running the technique
- Prepare - Decide the learning objectives for the observational study, typically structured(checklists) or unstructured(qualitative). Recruit a relevant sample size of participants associated to a target user profile. Decide on the type of observation- controlled or naturalistic.
- Run the exercise- Be mindful of user research ethics, and be open on how data collected will be used. Explain the purpose of the exercise, and the task that you wish the participants to undertake.
- Capture insight. What are users actually doing? As opposed to what you expected they might do. What routines do users have with the service? How are they integrating it into their lives? Record details – adding granularity and specificity to an observation can make it much more meaningful. Ensure you’re examining activities in their whole; look at how the service is used in context and the flow of their broader needs and not just at the service itself.
- Summary analysis. Use visualisation to highlight key learnings both from a quantitative and qualitative viewpoint
📖Authoritative source
Surveys
❓What is it
- Creating and distributing a structured questionnaire to gather insights, feedback, or data from users or potential users, and best for capturing quantitative attitudinal data. (attitudinal = ‘what people say’ v. behavioural ‘what people do’)
- Surveys typically provide a quantitative counterpart to the more qualitative methods typically used during the Discovery phase such as interviews or observations. It can also be used to complement other feedback loops during the Validation phase.
- It is primarily used to (1) quickly gather feedback from a large number of participants, (2) validate qualitative insights or hypotheses derived from other research method or (3) quantify and measure user needs, behaviors, and preferences
- This may be used in a qualitative approach through the use of open questions, but typically to complement other qualitative research.
👥Who
- User researcher.
🛠 Running the technique
- Prepare. Agree the learning objective with the product manager and service designer. Industry research clearly indicates it is very easy to write a bad survey that gathers flawed data.
- Top tips include: Keep the survey short, and only ask questions that clearly contributes the learning objective. Don’t ask questions that you can find the answer to via other data sources. Don’t ask questions that respondents can’t answer accurately. Use language that is neutral and simple - no formal words or terms. Focus on close ended questions versus open ended ones. Avoid double barrelled questions, e.g. How easy and intuitive was the task to do? Provide an opt-out as a response option, and design most questions to be optional.
- Choose a relevant medium for the target participant group to deploy the survey, that also provides the level of customisation and analytics capture required to meet the primary objective.
- Monitor the response rates(rule of thumb is >50 target sample size), close the survey and then undertake analysis of the results. Use a visualisation tool to communicate the insights with the team.
📖Additional source
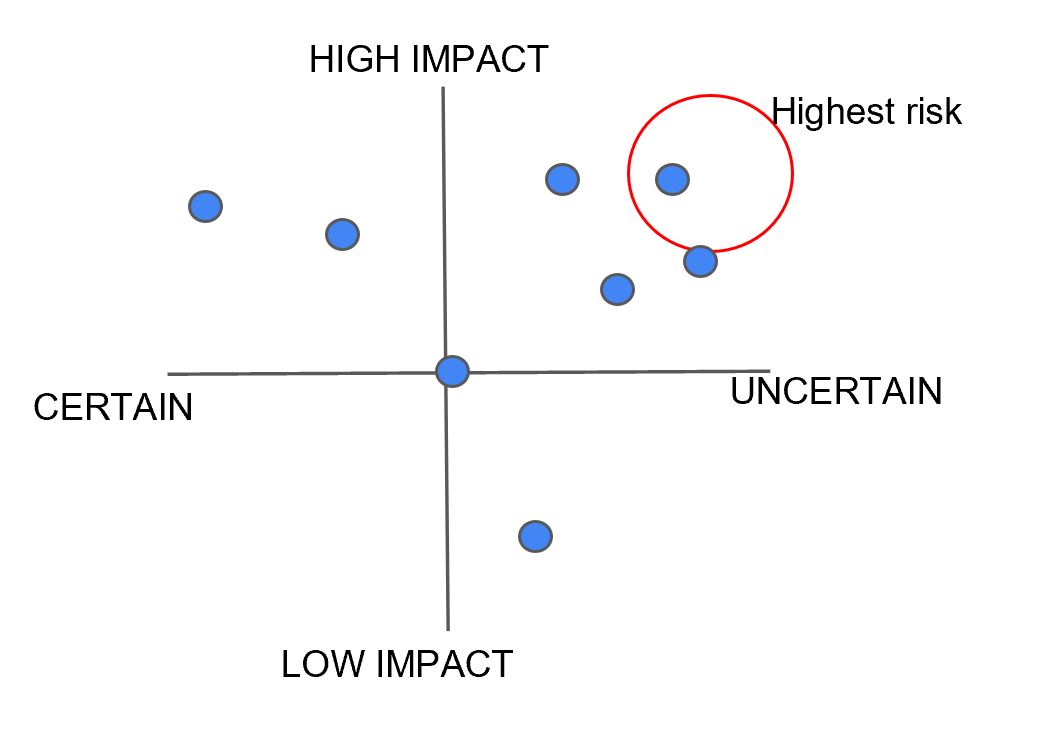
Assumption impact quadrant matrix
❓What is it
- A visualisation of the biggest assumptions and unknowns captured at various points through Ideation and Discovery phases.
- Captures the most important assumptions and unknowns and creates a relative priority of importance to address
- The visual centric representation accelerates understanding and frames more action oriented conversations with stakeholders and team members, unlike a more traditional approach of a RAID log.
- The quadrant matrix should be a living document throughout the Discovery and Validation phase, helping the team to collaboratively decide on the steps to take to de-risk the most impactful assumptions or unknowns in the form of hypotheses and experiments
- By addressing the most riskiest and impactful assumptions at the start, confidence of a valuable outcome can be rapidly increased
👥Who
- Product Manager or Delivery Manager where no product manager is available
🛠 Running the technique
- If a list does not already exist, use a workshop of team members and stakeholders to brainstorm any key assumptions and unknowns associated to the problem space
- Try and make the assumption clear and explicit in the form of a statement
- As a group respectfully challenge each of the assumptions to ensure a level of efficacy
- Assess how impactful each item is to achieving a valuable outcome, e.g. realising the value proposition
- As a core team use relative weighting to order each of the documented assumptions, across each of the axes
- This creates a natural priority to then address in defining an hypothesis and designing experiments to de-risk this assumption during the validation phase
Validation Techniques
Team Charter
❓What is it
- A Team Charter is a collaborative document defining a team's purpose, objectives, norms, and working agreements, serving as a foundational guide for team interactions and expectations.
- It should be initially created as part of getting ready for the Validation phase, and reappraised from reflections out of retrospectives
👥 Who
- Team charter technique is a team exercise, typically facilitated by the Delivery Manager.
- Only the core team should be involved in the exercise
🛠 Running the technique
- If running this virtually, the team can use an existing Team Charter exercise template on Westminster’s Miro account
- A 1-2-4-All technique can be used to facilitate consensus on the key statements to form the team charter
- Ensure all team members agree with the statements drafted.
- Focus of the statements should be on behaviours, expectations of ways of working within the team, promoting respectful accountability with each other, and reflect the purpose of the teams’ goals
- The statements should be intuitive and memorable and recommend around 6 to 8 statements are used at the outset to encourage recall and adoption
- Review and refine the team charter at various points of the team’s journey from initial mobilisation through to maturity
📖Additional source
(Team charter activity template, Visual Workspace for Innovation (miro.com) - copy as image here?)
Test and Learn Cards
❓What is it
- A simple to use template that encapsulates the experiment to run against a defined hypothesis.
- The template offers a single view of what is being tested, how it will be measured, success criteria, results from the experiment and the actionable learnings deduced from the results
👥Who
- The test and learn card is typically drafted by a product manager or service designer. If the experiment is technically focused, an architect may draft the card
- Once drafted it is reviewed and baselined by the whole core team, and may be shared with key stakeholders
🛠 Running the technique
- Complete the left hand side of the card - write the target outcome you are hoping for in the format of a prediction. Start the statement with ‘We believe that by (action taken) … (resulting outcome seen) ‘. This is the Hypothesis statement
- Define the tests that will be run for the experiment to prove or disprove the hypothesis. Focus on identifying a causal relationship between action taken and resulting outcome to build a high level of confidence in the efficacy of the experiment.
- Make sure your hypothesis can be tested empirically, capturing the variables that need to be measured - this ensures that the team can meet the requirements as part of developing and running the experiment
- Define the success criteria, what the outcome should demonstrate to deem the hypothesis proven. The success criteria should be definitive, with suitable degrees of confidence(>95%) where large volumes of data may be involved.
- Capture a summary of the experiment result, and the key actionable learnings to take forward to prioritise future work in Validation
Hypothesis Creation
❓What is it
- Acknowledges that no matter how much research you do, your service enhancement is just a theoretical solution to a human need or want that you hope will result in success. The hypothesis is your guess at why a particular solution will succeed. Valuable hypothesis comes from well researched observations.
- Hypothesis creation is the approach to how to best formulate a hypothesis that offers a valuable outcome.
👥Who
- Hypothesis creation is best undertaken collaboratively between the product manager and user researcher with support from the service designer, if such capability is available within the team
🛠 Running the technique
- Imagine the change wanted that fully addresses the outstanding user need and write it down.
- Identify what is preventing this outcome from being achieved. If these causes were removed the outcome would already be a reality. These are the root of the hypothesis
- Ideate solutions that offer alternative options to achieving the outcome by removing these causes/blockers
- Create the full hypothesis statement in this recommended format.
WE BELIEVE THAT ( feature/service) WILL ( define what will change and how )
FOR (target user group) WHEN WE SEE (the success criteria)
Cost of Delay Prioritisation
(also known as CD3 or WSJF)
❓What is it
- A prioritisation approach to make value and urgency more visible. It quantifies an opportunity cost in economic terms when work is delayed, enabling more objective decision making and trade off decisions.
- There are two basic inputs required to work out the Cost of Delay:
- 1. Value – Calculate a value of the benefits per period, based on an estimation of the work’s economic value to the organisation over a given time period.
- 2. Urgency – An understanding of the work’s urgency: when do the benefits start to occur or deteriorate? Is there a calendar peak period that is critical to make ?
👥Who
- The technique is typically used by a product manager as part of prioritising their product backlog and gaining consensus across stakeholders with conflicting viewpoints of what work is most valuable
🛠 Running the technique
- Calculate a benefits figure for the change derived from value definition work already undertaken.
- Work out when the benefits would start being realised or when the expected benefits may deteriorate if at all
- Derive a Cost of Delay figure using a standard period of time e.g. month
- Repeat the steps for initiatives or backlog items competing for the same capacity
- This provides an objective comparison on which to achieve transparent consensus
📖Authoritative source
- Principles of Product Flow (Donald G. Reinertsen)
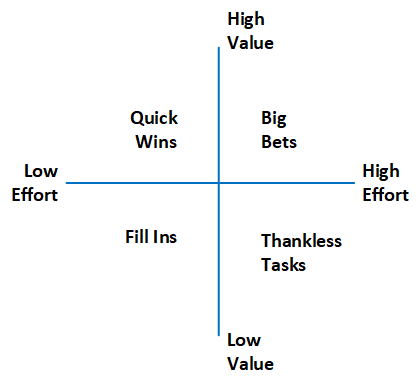
Effort/Value Matrix (2*2) Prioritisation
❓What is it
- It is used to help quickly prioritize a backlog of work associated to a service or product based on relative prioritisation. Each of the items are assessed against two criteria: the value that is realised from delivering it, and the effort required to complete it.
- It is the recommended prioritisation approach for backlogs with a large number of items(>20) for teams with little previous experience or competency in this activity.
- The key benefits for this technique are: Quick to understand and use for team members new to the service/initiative/product; strong visualisation to engender further discussion; highly productive in processing large backlog volumes in a short space of time; inherently enables high granularity of ordering; clear recommended next actions for each quadrant
👥Who
- Lead by the product manager, this technique only works well with a cross functional team and service SMEs working in a collaborative environment, with presence of at least one architect or developer
🛠 Running the technique
- Find a backlog item that to use as the anchor: find a previously delivered item on the backlog with a clear purpose, and effort taken and value expected would roughly enable it to sit in the middle of the matrix.
- Agree as a team to how value is defined to ensure consistency throughout the exercise
- Assess one item at a time, one person facilitates selecting and sharing details. Discuss and agree where to place it relative to the anchor item.
- Start with two or three more straightforward items (helps build confidence and understanding)
- Once completed, next recommend actions are Big bets ( top right) should be further broken down to identify and derisk the large effort estimate. Quick wins (top left) should be grouped against top level objectives and requalified.
- Agree sequencing of the items in the top left and top right segments.
A/B Testing
❓What is it
- Also known as Split testing is a method of comparing two versions of a digital asset, such as webpage or app against each other to determine which one performs better in terms of a given metric or objective. The idea is to show two variants (A and B) to similar users at the same time and then compare which variant better meets the desired action.
- Only one change can be tested at a time to ensure efficacy of the results
👥Who
- Collaboration between core team to design and run the test
🛠 Running the technique
- Hypothesis Creation: Before starting the test, you need a hypothesis. For example, you might hypothesize that changing of the position of ‘Register Account’ button from the bottom to the middle right will increase click-through rate of non registered users.
- Variants Creation: Based on your hypothesis, you would create two versions of the digital asset: Variant A: The current version (often called the "control"), Variant B: The new version with the change you want to test.
- Traffic Splitting: Visitors to the digital asset are randomly shown either variant A or variant B. Often, the traffic is split 50/50, but other ratios can be used depending on the circumstances.
- Data Collection: As visitors interact with each version, data is collected on how many take the desired action
- Result Analysis: After a sufficient amount of data is collected, the results are analysed. Statistical analysis helps determine if the differences in performance between the two variants are significant (i.e., not just due to random chance).
- Implementation: If Variant B (the change) proves to significantly outperform Variant A (the control), then you might decide to fully implement the change. If not, you can revert to the original or try a different test.
📖Additional source
- https://www.optimizely.com/optimization-glossary/ab-testing
Card Sorting
❓What is it
- Card sorting is a user-centred design technique used to explore how users group and categorize information, helping designers create or refine the information architecture of websites, apps, and other systems.
- This technique is particularly valuable in designing intuitive navigation structures and layouts based on users' mental models rather than the organization's internal perspectives or terminologies.
- Its specific purpose is to (1) understand how users perceive relationships and hierarchies between different pieces of content, (2) inform the structure and organization of a digital asset such as website, (3) improve or validate the design of navigation paths and menu structures.
👥Who
- Service Designer or User Researcher
🛠 Running the technique
- Preparation: Decide on the pieces of content or functionalities you want insights on. Write each piece on a separate card (physical cards, sticky notes, or digital equivalents).
- Sorting: Ask participants to sort the cards into groups that make sense to them. There are two main types of card sorting:
- Open Card Sorting: Participants create their own groups and name them. This method is useful for gaining insights into users' mental models and terminologies.
- Closed Card Sorting: Participants sort the cards into predefined categories. This is helpful when refining an existing structure.
- Analysis: After the sorting is complete, analyse the data to identify patterns, commonalities, and outliers in how participants grouped and labelled the cards. Further iterations of the exercise maybe valuable where the initial changes were substantive
📖Additional source
Data Analysis
❓What is it
- Data analytics is the process of analysing raw data in order to draw out meaningful, actionable insights, which are then used to inform and drive prioritisation and decision making.
- It is a key pillar of lean experimentation, in inspecting the outcome from running an experiment supporting a hypothesis. If the data sources points
- A key aspect of data analytics is attaining a suitable confidence interval(statistical significance) in the interpretation and validation of the summary analysis, to then drive subsequent decisions. This technique is focused on descriptive and diagnostic analytics
👥Who
- One of Data Analyst or Product Manager or Service Designer, or combinations thereof.
🛠 Running the technique
- Undertake a data audit against the key metrics that matter for the prioritised hypotheses and associated experiments so you can understand what data is captured, where it is captured and how to access it.
- Typical data sources include: Google Analytics for web based services, back office tools, customer support tools, 3rd party application providers, specialist experience management or product analytics tools (e.g. Qualtrics, Qualaroo, Heap, Amplitude)
- Inspect the data to ascertain the efficacy of both the raw data and how it is surfaced for interrogation by your team members.
- Where there is significant knowledge gaps for a current service, create a visual mapping on top of a service blueprint or customer journey map to identify the data source, metrics supported, level of confidence in its efficacy
- Work with the data analyst or architect or developer to identify the smallest effort to bridge the gap to attaining the metrics needs to complete the validation phase
NPS/ CSAT metric
❓What is it
- NPS and CSAT are the two primary industry wide measures to gauge end users overall satisfaction with a service and associated organisation.
- NPS stands for Net Promoter Score, and It measures user perception based on one simple question: ‘How likely is it that you would recommend the service / product to a friend or colleague?’ Responses fall into 3 categories, Promoters, Passives and Detractors.
- CSAT stands for Customer Satisfaction Score. While NPS provides a broader view of user perception of the organisation, CSAT provides a measure of short term user satisfaction with a specific interaction, product or service. CSAT is typically focused on more transactional and specific touchpoints.
- A combination of these two metrics provides invaluable near term and trending insight on user satisfaction.
👥Who
- Product Manager or Data Analyst
🛠 Running the technique
- For both NPS and CSAT, design the survey, question for the survey and distribution channel to reach the relevant section of users.
- For NPS the question is standard, "On a scale of 0 to 10, how likely are you to recommend [Organisation/Product/Service] to a friend or colleague?" One additional open question can be added to the survey to allow users to volunteer any additional comments..
- For CSAT, the response to a typical question, “How satisfied were you with your experience//service today” and a Likert scale is used to capture the response. CSAT surveys typically focus on sourcing feedback on improvements, new features or services to quickly validate that the proposed solution fully meets the needs of the users..
- Apply the standard formulae for both NPS and CSAT to derive the relevant scores.
📖Authoritative source
Lo-Fi Prototyping
❓What is it
- Lo-fi or low-fidelity prototyping, is a technique used in the early stages of the design process to create a simplified representation of a product or system. The primary goal of lo-fi prototyping is to visualize and test ideas quickly, allowing designers and stakeholders to iterate and refine concepts without investing significant time and effort.
- Its primary advantage during the validation phase is speed and velocity and reach. Speed to get something in the hands of end users to quickly and cheaply validate key assumptions, which allows a number of prototypes to be tested in a small time window.
- Because they are quick and cheap to produce, there's less emotional or financial attachment, making it easier for the fail fast principle to be collaboratively adopted with the team and stakeholders.
👥Who
- UX or Service Designer
🛠 Running the technique
- Good lo-fi prototypes should have the following characteristics: Speed to enable fast iterations from user feedback; Simplicity to reduce effort in creating and revising future versions, with ruthless focus on the core feature being tested; collaborative to encourage involvement and feedback from users and stakeholders
- Common methods include:
- Paper Prototypes: sketched wireframes, paper cut outs, printed screens, or hand drawn images
- Storyboarding: Sequence of drawings or pictures to outline user journeys or interactions.
- Clickable Prototypes using standard UX design software such as Sketch or Figma
Service Design Blueprint Mapping
(Future State)
❓What is it
- Service Design Blueprints come in two forms - current and future state mapping.
- A Future State Service Blueprint, much like a Current State Service Blueprint, is a visualisation tool used in service design. However, while the Current State Service Blueprint is used to map out the service as it exists presently, a Future State Service Blueprint represents how an organisation would like the service to be in the future. The purpose of a Future State Service Blueprint includes:
- Service Innovation and Improvement, Strategic Planning, Stakeholder Alignment, Implementation Roadmap, Change Management, Testing and Refinement
👥Who
- Service Designer or T-shaped UX designer
🛠 Running the technique
- A current live service should have an existing current state blueprint. If this is missing, then the team should make a decision on the value of completing this exercise.
- A Service Blueprint can range from a few days to several weeks or even months for very complex services or detailed blueprints. It's important to remember that the blueprinting process isn't just about creating the final artifact - the process of gathering information, involving stakeholders, and thinking through the service can be equally valuable. Work with the product manager to agree the level of detail that delivers the most valuable outcome in a timely manner.
- The Future State Service Blueprint should be detailed enough to capture all the proposed changes and how they will impact the service delivery and prioritised solution approach
📖Authoritative source
- (CSD miro board for detailed understanding of the process)
Usability testing
❓What is it
- Usability testing is a research method used to evaluate how usable, desirable and intuitive a service or feature is, by testing it with representative users. In this technique, participants are asked to complete specific tasks while observers watch, listen, and take notes. The goal is to identify any usability issues, collect qualitative and quantitative data, and determine the participant's satisfaction with the service.
- Typically, usability tests are conducted in a controlled setting, though remote usability tests are also common. Participants are asked to perform a series of tasks, often while thinking aloud, to provide insight into their cognitive processes. This helps the team understand not just what issues exist but also why they exist, providing a rich context to interpret results and make improvements.
👥Who
- Service Designer or UX Designer
🛠 Running the technique
- The core elements in most usability tests are the facilitator, the tasks, and the participant.
- The facilitator plans the usability test: define the test’s goals, participant selection approach, types of data to collect
- Recruit the right type of participants, typically 5 for qualitative studies. The participants should be a realistic user of the product or service being studied. That might mean that the user is already using the product or service in real life.
- Prepare and set up the test environment to provide the best outcomes for the target goal, e.g. testing in person or remote
- The facilitator administers tasks to the participants. As the participant performs these tasks, the facilitator observes the participant’s behavior and listens for feedback. The facilitator may also ask followup questions to elicit detail from the participant. Participants are often asked to think out loud during usability testing (called the “think-aloud method”).
- Analyse the results to surface critical insights against the target goals defined at the outset.
📖Authoritative source
User Story Mapping
❓What is it
- User story mapping is a visual representation of the user journey across a product or service. It helps teams understand the functionality and prioritise development tasks, ensuring that the user's perspective and needs remain at the forefront.
👥Who
- User story mapping only delivers any benefit when done as a team activity. The whole core team should take part in this activity to ensure diversity and aligned understanding on any MVP candidates.
🛠 Running the technique
- Find a large wall or digital collaboration tool like Miro. Begin by outlining the backbone of your user's journey. This is a series of high-level activities or key steps the user goes through when interacting with the service.
- These are positioned sequentially from left to right, reflecting the order in which they typically occur.
- Below each high-level activity, you'll break it down into more granular tasks or sub-activities.
- Now, for each of these tasks or sub-activities, you'll develop a user story or backlog item.
- The vertical positioning of user stories under each activity can indicate priority, with higher priority items at the top.
- This helps teams understand what should be developed first to deliver the most valuable features to the user early on.
- By viewing the map, teams can group certain user stories together into logical releases or iterations. This is especially useful when determining the features for a Minimum Viable Product (MVP) versus those for subsequent releases.
📖Additional Material
Delivery Techniques
User Story Mapping
❓What is it
- User story mapping is a visual representation of the user journey across a product or service. It helps teams understand the functionality and prioritise development tasks, ensuring that the user's perspective and needs remain at the forefront.
👥Who
- User story mapping only delivers any benefit when done as a team activity. The whole core team should take part in this activity to ensure diversity and aligned understanding on any MVP candidates.
🛠 Running the technique
- Find a large wall or digital collaboration tool like Miro. Begin by outlining the backbone of your user's journey. This is a series of high-level activities or key steps the user goes through when interacting with the service.
- These are positioned sequentially from left to right, reflecting the order in which they typically occur.
- Below each high-level activity, you'll break it down into more granular tasks or sub-activities.
- Now, for each of these tasks or sub-activities, you'll develop a user story or backlog item.
- The vertical positioning of user stories under each activity can indicate priority, with higher priority items at the top.
- This helps teams understand what should be developed first to deliver the most valuable features to the user early on.
- By viewing the map, teams can group certain user stories together into logical releases or iterations. This is especially useful when determining the features for a Minimum Viable Product (MVP) versus those for subsequent releases.
📖Additional Material
3Cs (Backlog Refinement)
❓What is it
- The Three Cs stand for Card, Conversation, and Confirmation and is a approach to refinement of the backlog items so that they are ready to be considered for inclusion in a sprint backlog.
- It's a technique that emphasises the importance of a user story (Card), the discussion around it (Conversation), and the acceptance criteria (Confirmation) to ensure clear understanding and expectations across the team tasked with delivering that value.
- A “Card” (or often a Post-It note), a physical token giving tangible and durable form to what would otherwise only be an abstraction:
- A “Conversation” taking place at different time and places between the various people concerned by a given feature of a software product: customers, users, developers, testers; this conversation is largely verbal but most often supplemented by documentation
- The “confirmation”, finally, the more formal the better, that the objectives the conversation revolved around have been reached.
👥Who
- Primarily lead by the product manager
🛠 Running the technique
- A Card (or often a physical or virtual Post-It note) is just a placeholder that signifies there is a customer requirement. It’s like an item on a to-do list or a reminder taped to the fridge. A token. Create a user story with a title and value statement and maybe one or two acceptance criteria
- Next engage your team members or a service owner in a Conversation. Embellish and refine the first draft from insights gained from this Conversation. This should include a description and further acceptance criteria.
- Ensure Confirmation with a final refinement session that validates mutual understanding of the valuable outcome being targeted, what requirements need to be satisfied, and an estimate of the effort to achieve this
📖Additional Material
User Story Writing
❓What is it
- User story writing captures product requirements from the perspective of the end user that derives a valuable outcome from this requirement being delivered.
- It must have a short meaningful title, value statement, and acceptance criteria, but may also have a description or other supporting business and technical insights that helps the team to estimate and deliver the requirements.
- Apply INVEST principle to improve focus on value outcomes
👥Who
- User story writing is undertaken primarily by someone acting in the role of product manager. During and post refinement other team members may contribute to the user story.
🛠 Running the technique
- The user story title should reflect the valuable outcome, and not the intermediate steps. Try to use a single active verb and object. e.g. Display current personal details
- The value statement should take the form of … AS A (describe the end user who has a need) I WANT TO (the action to take) SO THAT (the benefit/ valuable outcome achieved)
- Write a description of what goods looks like when this user story is delivered, if this may help refinement with team members
- Ensure the user story adheres to the INVEST principle: Independent, Negotiable, Valuable, Estimable, Small, Testable
- Draft the acceptance criteria that needs to be satisfied. Please refer to the BDD technique guide for further detail.
- Engage with relevant team members to refine and estimate.
📖Additional Material
Cost of Delay Prioritisation
(also known as CD3 or WSJF)
❓What is it
- A prioritisation approach to make value and urgency more visible. It quantifies an opportunity cost in economic terms when work is delayed, enabling more objective decision making and trade off decisions.
- There are two basic inputs required to work out the Cost of Delay:
- 1. Value – Calculate a value of the benefits per period, based on an estimation of the work’s economic value to the organisation over a given time period.
- 2. Urgency – An understanding of the work’s urgency: when do the benefits start to occur or deteriorate? Is there a calendar peak period that is critical to make ?
👥Who
- The technique is typically used by a product manager as part of prioritising their product backlog and gaining consensus across stakeholders with conflicting viewpoints of what work is most valuable
🛠 Running the technique
- Calculate a benefits figure for the change derived from value definition work already undertaken.
- Work out when the benefits would start being realised or when the expected benefits may deteriorate if at all
- Derive a Cost of Delay figure using a standard period of time e.g. month
- Repeat the steps for initiatives or backlog items competing for the same capacity
- This provides an objective comparison on which to achieve transparent consensus
📖Authoritative Source
- Principles of Product Flow (Donald G. Reinertsen)
Effort/Value Matrix (2*2) Prioritisation
❓What is it
- It is used to help quickly prioritize a backlog of work associated to a service or product based on relative prioritisation. Each of the items are assessed against two criteria: the value that is realised from delivering it, and the effort required to complete it.
- It is the recommended prioritisation approach for backlogs with a large number of items(>20) for teams with little previous experience or competency in this activity.
- The key benefits for this technique are: Quick to understand and use for team members new to the service/initiative/product; strong visualisation to engender further discussion; highly productive in processing large backlog volumes in a short space of time; inherently enables high granularity of ordering; clear recommended next actions for each quadrant
👥Who
- Lead by the product manager, this technique only works well with a cross functional team and service SMEs working in a collaborative environment, with presence of at least one architect or developer
🛠 Running the technique
- Find a backlog item that to use as the anchor: find a previously delivered item on the backlog with a clear purpose, and effort taken and value expected would roughly enable it to sit in the middle of the matrix.
- Agree as a team to how value is defined to ensure consistency throughout the exercise
- Assess one item at a time, one person facilitates selecting and sharing details. Discuss and agree where to place it relative to the anchor item.
- Start with two or three more straightforward items (helps build confidence and understanding)
- Once completed, next recommend actions are Big bets ( top right) should be further broken down to identify and derisk the large effort estimate. Quick wins (top left) should be grouped against top level objectives and requalified.
- Agree sequencing of the items in the top left and top right segments.
BDD - Behaviour Driven Development
❓What is it
- Acceptance criteria in the context of BDD refer to the specific behaviours a system should exhibit in order to be considered correct, the scenarios in which all possible acceptable behaviours are described. The approach focuses using plain language that everyone involved can understand.
👥Who
- The primary creators of acceptance criteria is the product manager
- During refinement the product manager works collaboratively with the tester and developer to review and baseline the acceptance criteria and efficacy of the syntax
🛠 Running the technique
- Identify each possible scenario that might validly occur for the backlog item
- For each scenario, define the behaviour that must be met for it to be considered done and accepted
- Define each behaviour in the form of : GIVEN… (define the precondition, setting the scene) , WHEN.. (define the action to be taken, the thing we are testing), THEN…(define the expected result occurring from that action). An ‘AND maybe added to any of the three statements.
📖Additional Material
Vertical Story Slicing
❓What is it
- Vertical story slicing" is a concept used primarily in agile software development, specifically in the context of breaking down user stories. The main goal of vertical slicing is to deliver a thin, yet functional slice of the overall system that cuts through all the architectural layers and components, delivering value to the end user. This contrasts with "horizontal slicing," where you might build out a complete layer of the system, but the user sees no functional value until all layers are completed.
👥Who
- A collaborative activity involving the product manager, developer and architect
🛠 Running the technique
- Functional Value: Each vertical slice should provide some kind of value to the user, even if it's minimal. This means that after implementing a vertical slice, there should be a usable piece of the product, even if it's only a small feature.
- All Layers: A vertical slice touches every layer of the application. If you imagine the system as a layered cake with a UI layer, service layer, and database layer, a vertical slice would be a thin piece that cuts through all those layers.
- Small and Manageable: Each slice should be small enough to be developed within one iteration. This allows for faster feedback and quicker adjustments based on real-world use or stakeholder feedback.
- Minimize Dependencies: By focusing on vertical slices, teams can minimize dependencies on other parts of the system. This reduces waiting times and increases the team's ability to deliver continuously.
User Story Splitting
❓What is it
- User story splitting breaks down a large user story into smaller multiple user stories that can be delivered earlier given their reduced complexity and size. Smaller sized user stories are easier to accommodate into the overall sprint plan.
- This technique is best employed on user stories that have a large effort estimate.
- The approach to splitting the user story should ensure value can be delivered to the user in each smaller story, so still adheres to the INVEST principle
👥Who
- A collaborative activity with the product manager and developers involved with the original user story
🛠 Running the technique
- Find the best pattern to split the story. The functionality associated to the story typically leans towards one option more than others.
- Tried and tested patterns are : Workflow Steps, Operations to perform, Business rules that need to be applied, Variations in data, User interface options, simple functionality/complex functionality, defer performance
- After applying a split test each candidate against the INVEST principle. If one of the smaller stories fail, find another user story that it can be merged with.
- The number of split stories created will depend on the scope and complexity of the original user story. Use a guideline that each split user story should take no more than 15% of your sprint capacity to achieve
- Reprioritise the split user stories - you may find that some of the smaller user stories are not as valuable as others.
- Please refer to the additional material source for the full flowchart of splitting patterns
📖Additional Material
Estimation - Planning Poker
❓What is it
- It is a consensus-based estimation technique that produces quick and reliable estimates backed by the whole development team. It is highly recommended to purchase a purposed planning poker card deck.
- A good planning poker card deck is based on the Fibonacci series- 1,2,3,5,8,13,20,40,100
👥Who
- Everyone that does the work is involved, so typically only the developers should be involved
- If the work item is wholly related to a specialism, e.g. research, UI design, testing then only team members who have experience of that specialism should take part.
🛠 Running the technique
- Agree consensus on average value using a previously worked backlog item, e.g. a value of 5
- The backlog item is presented by the product manager or delivery manager, with a short team discussion
- Each team member allowed to vote, does so privately. The cards are then all shown.
- If the scores are in general consensus, e.g. 3, 2,5, 3, 3, then the score is recorded
- Where there is notable variation, e.g. 2, 3,3,5,10,5, then the members with the highest and lowest scores share their thinking. Everyone then repeats the activity, until consensus is reached.
📖Additional Material
Sprint Planning
❓What is it
- It's the event where the team determines the backlog items they will work on during that sprint and discusses their initial plan for completing those backlog items. Typical duration should be between 1 and 2 hours.
- The sprint planning session should not involve any significant focus on refining or estimating backlog items. These activities should have been completed by the team in advance of sprint planning, and only the odd exceptional item should be raised and discussed during this session .
👥Who
- Facilitated by the delivery manager, this technique involves the whole core team
🛠 Running the technique
- The product manager should begin the sprint planning session with proposing the draft sprint goal(s), and explain the rationale behind them
- The team discusses and agrees with the sprint goal.
- The product manager then proposes their candidates for inclusion in the sprint, with particular focus on the value being delivered by each item.
- Each candidate item is summarily presented with the opportunity for any of the team to raise any last minute questions or concerns on aspects such as estimate, acceptance criteria or the proposed value outcome
- The delivery manager then facilitates discussion with the team regarding the confidence of achieving all the scope against expected capacity for the sprint. This may result in negotiating with the product manager to reduce the scope of the sprint backlog.
📖Additional Material
(Agile bootcamp handbook. )
Sprint Retrospectives
❓What is it
- Regular Retrospectives are dedicated sessions where teams reflect on their processes and performance, aiming to identify areas for improvement and celebrate successes.
- The event is a safe place with no observers or participants outside of the core team, encouraging an open and transparent dialogue within the team
👥Who
- Facilitated by the delivery manager, this technique involves the whole core team
🛠 Running the technique
- Retrospectives should be scheduled on a regular basis at the end of a sprint or iteration for around a one hour timeframe
- The team should jointly agree the ground rules of running this event
- Discussion is typically facilitated by the delivery manager, although volunteering to run the session offers learning opportunities in more established teams.
- Discussion should focus on how work is done and the dynamics and working relationships within team members. Discussion on the content of the work completed should be excluded- this is covered in a sprint review event
- All voices and viewpoints should be treated as equal and valid in this session, irrespective of the role
- It is recommended to use a template to help frame the conversation. There are numerous freely available templates that can be used in a physical or virtual meeting.
- Good sessions should surface at least one proposed improvement to take forward and implement in the next iteration
📖Additional Material
(Agile bootcamp handbook)
Sprint Review
❓What is it
- Sprint reviews takes place in an informal atmosphere at the end of each sprint, with the team sharing what has been achieved with stakeholders and where possible end users. The review provides a valuable opportunity for early feedback on the deliverable increment from the people that matters most- end users and stakeholders. Sprint reviews are also known as Show and Ask intimating the conversational nature of a good sprint review event.
👥Who
- Product Owner leads the sprint review, but all the team should attend as this is an opportunity to hear feedback first hand
🛠 Running the technique
- Plan for about 60 to 90 minutes to run the review for a typical 2 week sprint.
- It is recommended that the team employ an open invite approach casting a wide net across interested communities to maximise feedback on the deliverable increment.
- Open the sprint review with a reminder of the sprint goal, and then present in an informal manner the deliverables completed during the sprint. It is good practice to encourage the developer/designer of a specific deliverable to present this to the audience.
- Encourage open dialogue and feedback from the audience, and note down any specific points of interest that might be worth further exploration in a future sprint, and refinement of the existing backlog.
- Complete the review with a quick summary outlook of the product backlog and likely candidates for the next sprint.
- Following the sprint review, the team discusses any new insights from the feedback and amend the product backlog if appropriate.
📖Additional Material
(Agile bootcamp handbook)
Infrastructure as Code (IAC)
❓What is it
- Infrastructure as code (IAC) is a formalised way of scripting infrastructure requirements that can then be played, and replayed, in a target environment.
- Because the setup is scripted it removes the possibility of human error when executing and can be backed up and managed in source control.
👥Who
- DevOps engineers.
🛠 Running the technique
- There are different formats required for different targets. Azure uses ARM, for example, Terraform can be configured cross-cloud, Vagrant can configure virtual machines and Kubernetes manifests are also in this category.
- Just like with software, you should test your IaC on a dummy environment before making changes to anything live.
- Your deployment pipeline should run the scripts in a target environment as part of the deployment process: Build, Test, Create (Iac), Deploy
📖Additional Material
Run Techniques
Cohort Analysis
❓What is it
- An analytical technique that focuses on analysing the behaviour of a group of users over time, thereby surfacing insights about the experiences of those users, and what the organisation can do to improve those experiences. It is especially useful in benchmarking user engagement for a new service or feature or user journey refresh of an existing service.
- This technique is only applicable where the average user interaction rate with the service is regular, e.g. at least monthly.
- A typical trigger to use this technique may be the launch of a new service, new feature in an existing service, or major redesign of a key user journey.
👥Who
- Product manager or data analyst
🛠 Running the technique
- There are 3 key anchors to employing this technique: Define the cohort group.
- Define the cohort group - the trigger event to start tracking - e.g. deploy new web site, new user journey - and the attributes for inclusion - e.g. existing users, use of mobile channel.
- Define the time box, the lagging period, that you want to run your analysis for. A typical value would be one month.
- Define the period on which to run the analysis. This should be long enough to identify any trends from the new deployment. A typical value would be 3 months.
- Configure the tracking on the web analytics tool in time for the deployment of a key new feature or service.
- Use the web analytics reporting dashboard to visualise the performance of each cohort group- weekly, monthly etc.
- Identify unexpected trends emerging and prioritise these for more indepth analysis.
- In depth analysis may be undertaken via the data analytics tools or qualitatively via user interviews to identify potential root causes.
📖Additional Material
Logging and Monitoring
❓What is it
- Logging and monitoring are two different processes that work together to provide a range of data points that help track the health and performance of your infrastructure. Monitoring uses application metrics to measure availability and manage performance. Logging creates a record of log events generated from applications, devices, or web servers that serves as a detailed record of occurrences within a system.
👥Who
- This is usually performed by a DevOps person or overarching application support team
🛠 Running the technique
- Make sure that your monitoring tool supports your application's programming language to ensure compatibility and ease of use.
- Log the right data - Log data needs to tell a succinct but complete story. Helpful log data generally includes actionable items, and includes information such as a timestamp, user IDs, session IDs, and resource-usage metrics.
- Collecting a full range of applicable data enhances the information obtained from your monitoring tool.
- Streamline your data by making it easier to search, index, and store be ensuring that it is structured, offering a more complete view as to what happened, and can provide your monitoring tool with unique identifiers such as which account ID experienced the error.
- Identify application and system trends by applying statistical analysis to system events. Use the historical information provided by log data to determine averages that will make it easier to definitively identify anomalies, or to group event types in a way that allows for accurate comparisons.
📖Additional Material
(Reference ITIL 4 framework)